The number of Black eligible voters in the United States has grown at a modest pace in recent years and is projected to reach 32.7 million in November 2022. At the same time, Black eligible voters stand out for their relatively high voter turnout rates – 51% in 2018, higher than the turnout rates for Latino and Asian eligible voters in the same year (40% each).
Black voters could play an important role in determining the outcome of key 2022 midterm races in the United States in November. Notably, Black Americans in Georgia account for a third of eligible voters and will cast ballots in a closely followed race that could determine which party controls the U.S. Senate next year.
In an August 2022 Pew Research Center survey, 70% of Black registered voters said they would vote for or were leaning to the Democratic U.S. House candidate in their district in the coming election. Another 24% were either unsure or said they would back another candidate. Just 6% of Black registered voters said they would back the Republican candidate in the race to represent their district in the House of Representatives.
Ahead of the midterm elections, here are five key facts about Black eligible voters in the U.S., based on Pew Research Center projections for 2022, as well as Census Bureau data for earlier years. (Eligible voters in this analysis are defined as citizens ages 18 and older residing in the 50 states and the District of Columbia. Not all eligible voters are actually registered to vote. Detailed demographic information about Black eligible voters is available in the drop-down box at the bottom of the post.)
This post is one in a series that explores the eligible voter population in the United States in 2022. For this analysis, we examine the detailed demographics and geographic distribution of Black Americans who were eligible to vote in the U.S. in 2020, with projections about the Black eligible voter population in 2022.
In this analysis, the Black population is defined as those who report their race as Black alone and non-Hispanic, Black and at least one other race and non-Hispanic, or Black and Hispanic. The term “eligible voters” refers to persons ages 18 and older who are U.S. citizens. This analysis was conducted with respect to those living in the 50 states and the District of Columbia.
The analysis is based on data from the U.S. Census Bureau’s American Community Surveys from 2020, 2018, 2016, 2012 and 2008, and the 2000 U.S. decennial census provided through Integrated Public Use Microdata Series (IPUMS) from the University of Minnesota.
Projections for November 2022 use population estimates by age derived by extrapolating 2020 data from the American Community Survey (IPUMS) with the U.S. Census Bureau’s Vintage 2021 population estimates for July 2020 and November 2022. Projected values of the share who are U.S. citizens are based on trends drawn from the 2010-2019 American Community Surveys (IPUMS).
Read other posts in this series
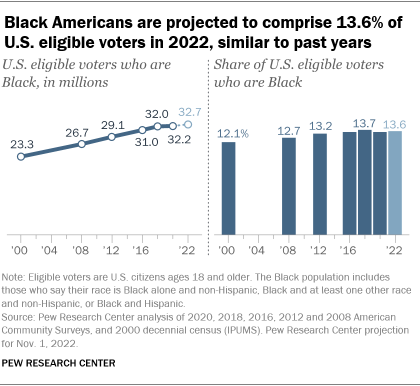
Black Americans are projected to account for 13.6% of all eligible voters in the United States in November, according to new Pew Research Center projections. This represents little change since the last midterm election in 2018, when they accounted for 13.7%. The percentage of eligible voters who are Black has changed little in the past two decades.
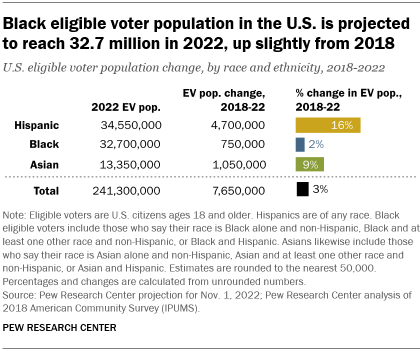
The number of Black eligible voters has grown steadily in recent years and is projected to reach 32.7 million by November. This figure is estimated to have grown by 1.8% between 2020 and 2022, a smaller rate of growth than among Asian eligible voters (2.4% growth) and Hispanic eligible voters (6.9% growth) during the same period.
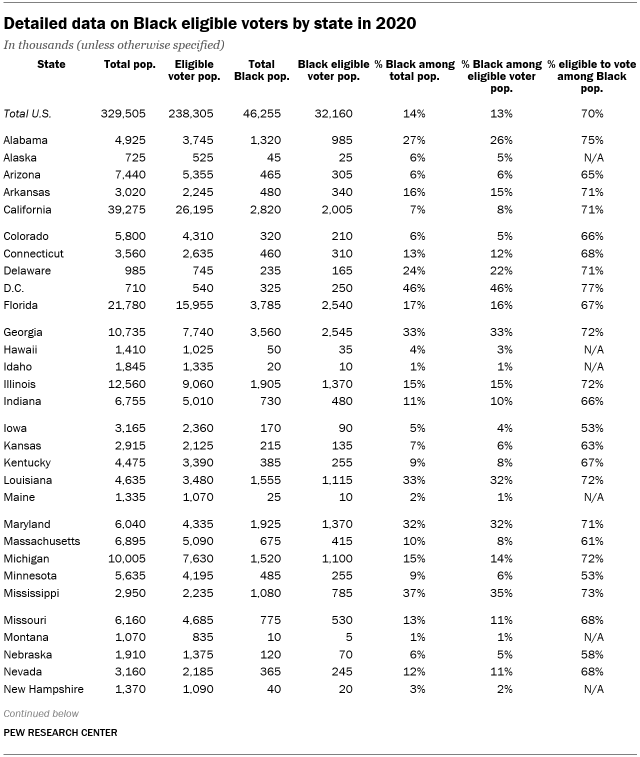
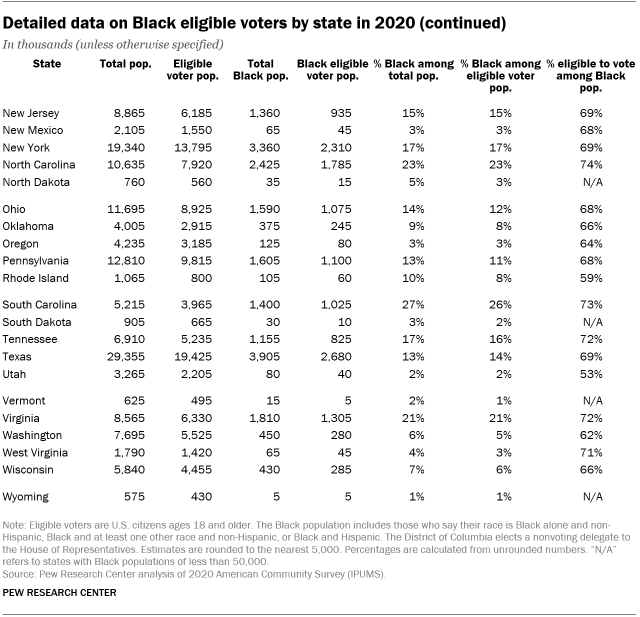
As of 2020, eight states are home to about half of all Black eligible voters in the United States. Texas has the largest number, with 2.7 million, followed by Georgia and Florida (each 2.5 million). Rounding out the top eight are New York (2.3 million), California (2.0 million), North Carolina (1.8 million), and Maryland and Illinois (1.4 million each). Together, these states account for 52% of Black eligible voters in the 50 states and D.C.
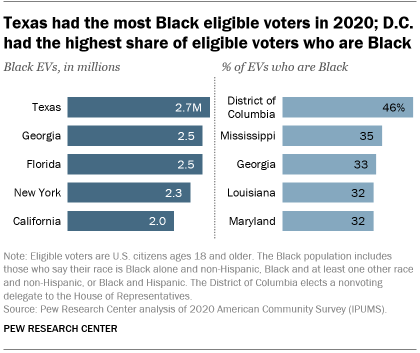
Black voters made up nearly half (46%) of all eligible voters in the District of Columbia in 2020, a higher share than any state. Other places with large shares of Black eligible voters are Mississippi (35%), Georgia (33%), Louisiana (32%) and Maryland (32%).
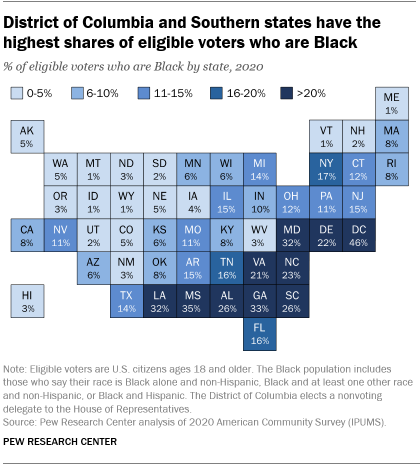
Regionally, more than half of Black eligible voters (57%) live in Southern states. The Midwest and Northeast (17% and 16%, respectively) have similar shares of the national total of Black eligible voters, with the rest of Black eligible voters living in Western states (10%).
Seven-in-ten Black people in the U.S. are eligible to vote, compared with 72% of all people living in the country. Two facts that explain this consistently high eligibility are that a large share of the Black population are age 18 or older (73%) and an even larger share are citizens (96%), if not native-born citizens (90%).
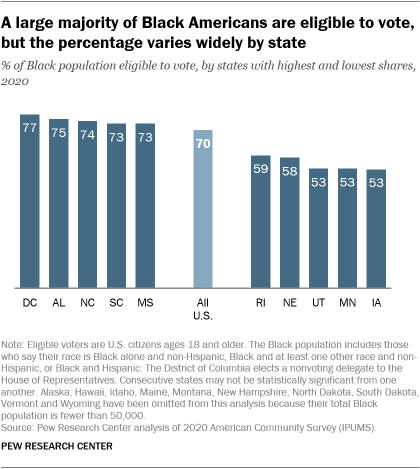
Nevertheless, the share of the Black population that is eligible to vote varies considerably by state. While 77% of all Black residents of D.C. are eligible to vote, the share falls to about six-in-ten in Rhode Island (59%) and Nebraska (58%). The share of Black residents eligible to vote is lower still in Utah, Minnesota and Iowa (53% for each).
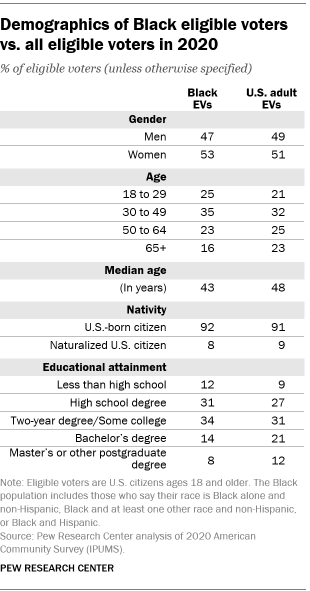
Black eligible voters differ from the broader population of eligible voters by age, education and other factors. The median age of Black eligible voters in the U.S. is 43, compared with 48 among the overall eligible voter population. Black eligible voters are about as likely to be native-born citizens as the general eligible voter population (92% and 91%, respectively).
Around one-in-five Black eligible voters (22%) have a bachelor’s degree, lower than the share among all U.S. adults eligible to vote (33%). Another 34% have at least some college education or an associate degree. The remaining 44% have a high school diploma or less.
Black eligible voters are about as likely as eligible voters overall to be women (53% vs. 51%). Black eligible voters are more likely to be women than they are to be men (53% vs. 47%).
"about" - Google News
October 13, 2022 at 01:00AM
https://ift.tt/T95lYwv
Key facts about Black eligible voters in 2022 - Pew Research Center
"about" - Google News
https://ift.tt/NBuIlTg
Bagikan Berita Ini


0 Response to "Key facts about Black eligible voters in 2022 - Pew Research Center"
Post a Comment